The Importance of Infographics

The Importance of Infographics
3 minutes read. August 5th, 2020.

Why Choose Infographics?

Created to educate and inform, an infographic uses design rationale to simplify complex data and present it in an easy-to-digest format. Nobody enjoys staring into an endless abyss of statistics – thankfully, an infographic can contextualise information and save us from drowning in a sea of numbers and figures.

The versatility of infographics is what makes them so attractive as a design solution. There are a number of ways to present data, including:

  • Timelines
  • Flow charts
  • Maps
  • Graphs
  • Diagrams
  • Figures
  • Side-by side comparisons
  • Ordered lists

Take a look at our portfolio to view some of our creative projects
The Key to an Effective Infographic

Infographics should always aim to show, rather than tell. Although text always plays a vital role in any design, the visual aspects of an infographic should be able to communicate effectively without an over-reliance on typography.

When creating an infographic, it’s not just about producing something that looks good – designers must also be able to figure out the best way of visualising and representing data depending on the topic at hand. The central concept behind an infographic should be reflected in the data that is being presented, which is why a designer needs to be able to interpret the relationship between different sets of information.

Branded is Beautiful

If it’s branding you’re interested in, infographics can of course be designed to adhere company guidelines. Branded infographics are effective because they tell a data-driven story alongside your brand’s own narrative, offering an ideal means of applying your company’s expertise and authority to matters. Whether designed for a set of annual reports or an Instagram post, an engaging and relevant infographic will lead people to value your brand’s credibility.

Impactful infographics don’t just display data – they emotionally connect with audiences. Ultimately, you’re looking for a reaction from people, a feeling which – by association of visual elements such as your logo, colour choice and typography – will remind people of your brand.

Making Things Move

Nowadays, grabbing the attention of audiences from the get-go is becoming an increasingly difficult task. Turning static infographics into animated ones provides a potential solution.

Animated infographics can show processes and depict how a story unfolds. By showing the transition of information from one point to another, we can break things down and help viewers to grasp exactly what is being communicated.

As we’ve mentioned, audiences are more responsive to visuals that provide emotional stimulation. Combine that with the engagement that motion graphics brings to the table and you’ll increase the likelihood of content being shared, ultimately widening your audience reach. Whether breathing new life into older static infographics or producing something completely new, there’s no doubt that incorporating animation allows you to get more mileage out of infographics.

Conclusion

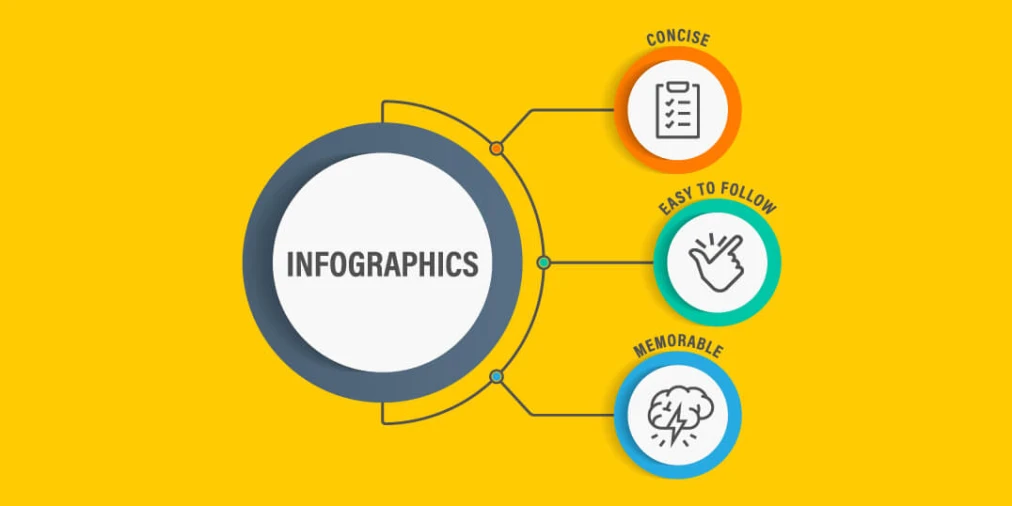
Simplifying data into a digestible and visually pleasing format isn’t always a walk in the park – but it is effective. Infographics reach out to people: they’re concise, easy-to-follow and, most important of all, memorable. Capitalise on all three of those qualities and you’ll soon leave a lasting impression on your audience.

Interested in creating a killer infographic? Get in touch with the Think!Creative team today.

Spread the word, share the love, pass it on. If you like this article, feel free to share using the handy link below.

Wanna get in touch?

The Importance of Infographics

Paul Hough

Creative Director

Get in touch with me